2/23/2023
Feb 23, 2023

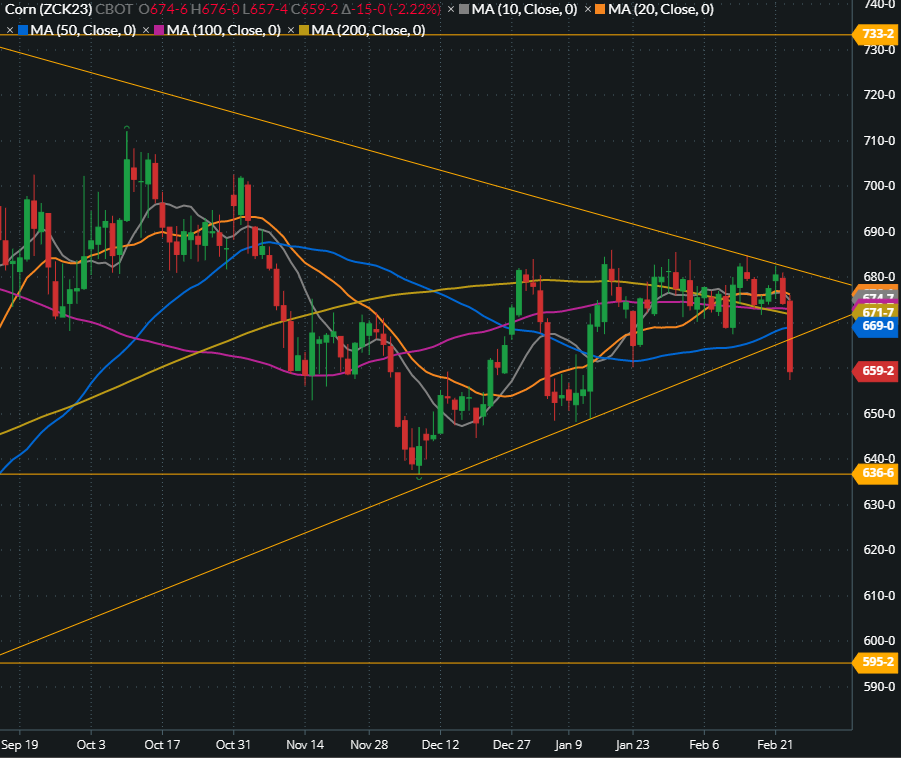
Corn was down double-digits on some of the biggest volume we've seen so far this year. The May contract gave away 15 cents on 258k contracts traded, the largest single-day volume for this contract. Soybeans settled just above their daily lows to post modest losses of 7-9 cents on average trading volume. The USDA Ag Outlook Forum Data gave us our first looks at what could potentially be our 2023/24 crop balance sheets but these numbers do not carry much weight. They are predicting 91 million corn acres and a yield of 181.5 bushels/acre with ending stocks printing at 1.88 billion bushels. This would result in a large bump in corn ending stocks from the current 1.27 bln bushels. Soybean plantings were predicted at 87.5 million acres with a yield 52 bushels/acre. This estimate pegs ending stocks at 290 million bushels. A modest increase from the current 2022/23 balance sheet. Weekly ethanol data showed output up 15,000 barrels/day to 1.03 mln bpd. Stocks increased by 249k barrels to 25.59 mln barrels.
Corn appears to be breaking out of some long-term consolidation to the low side. There is a good chance we see a potential visit to the December lows (636’6 on the May 23 chart) on this move.

Corn appears to be breaking out of some long-term consolidation to the low side. There is a good chance we see a potential visit to the December lows (636’6 on the May 23 chart) on this move.
