3/31/2022
Mar 31, 2022

In traditional fashion, the USDA surprised the market with their estimated acres for both corn and soybeans.
Corn: estimated at 89.5 million acres for 2022, down 3.87 million acres from last year (-4%)
Soybeans: estimated at 91.0 million acres for 2022, up 3.8 million acres from last year (+4%)
All Wheat: estimated at 47.4 million acres for 2022, up 0.6 million acres from last year (+1%)
North Dakota was the biggest wild card with 2022 acres compared to last year at -12% corn, -3.4% soybeans, +11.1% hard red wheat, +11.4% durum wheat, and spring wheat -5.5%. Given that its North Dakota, this affects actual total corn and soybean production far less than the loss in total acres. Trade maybe took that into consideration. Old crop corn traded close to limit higher but never touched limit, new crop corn touched limit briefly on the initial reaction after the report. Today’s report was extremely bearish for soybeans which anchored back corn.
Grains stocks as of March 1, 2022.
Corn: stocks in all positions totaled 7.85 bln bushels, up 2% from March 1, 2021.
Soybeans: stocks in all positions totaled 1.93 bln bushels, up 24% from March 1, 2021.
All wheat: stocks in all positions totaled 1.02 bln bushels, down 22% from March 1, 2021.
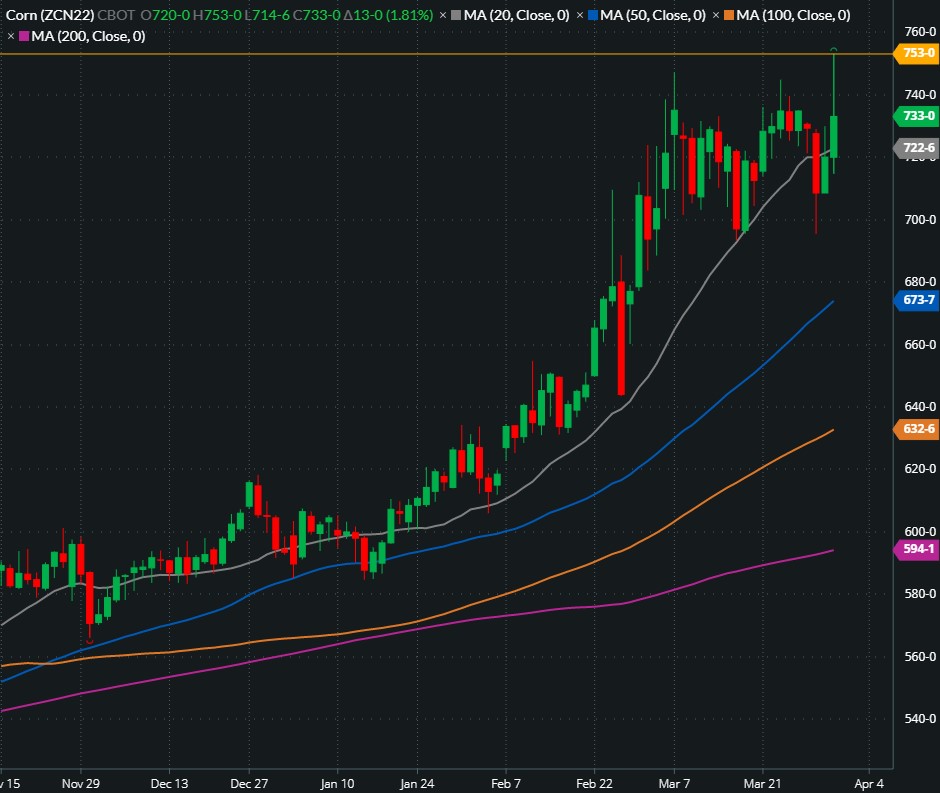
HUGE bullish initial reaction in corn following the report but end the day 20 cents off the contract’s new high and well below the previous contract high of 747’0. It will be very interesting to see how we close the week, we have potential for a large weekly reversal in EITHER direction.

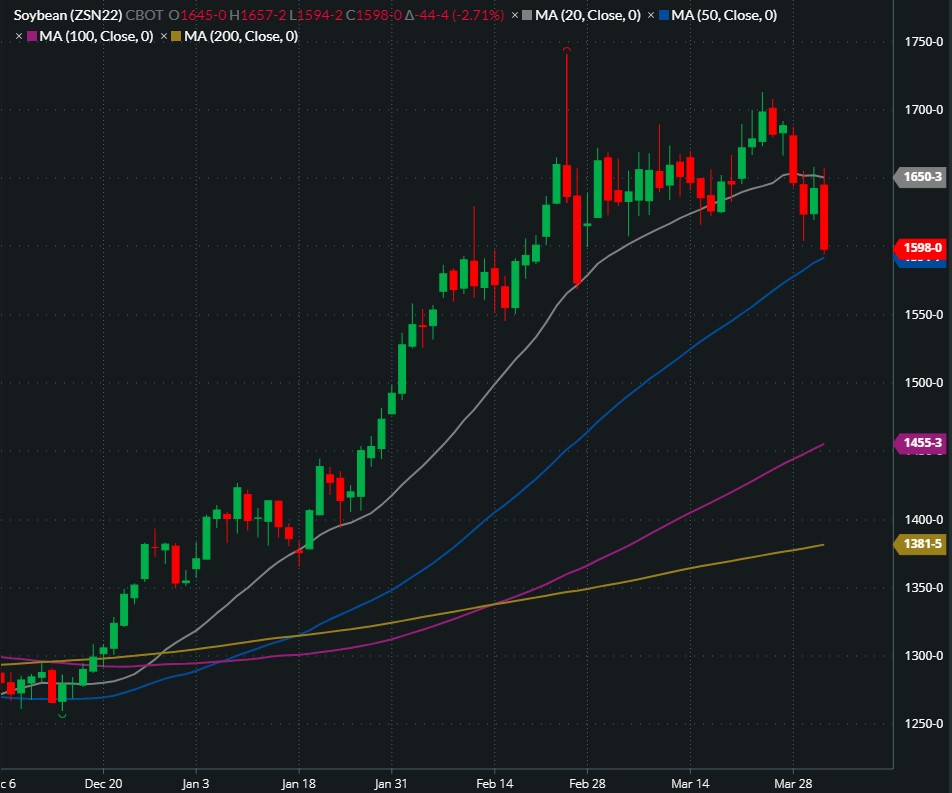
Funds could not dump soybean long positions fast enough following the prospective planting report. July soybeans found immediate support at the 50-day moving average.

Corn: estimated at 89.5 million acres for 2022, down 3.87 million acres from last year (-4%)
Soybeans: estimated at 91.0 million acres for 2022, up 3.8 million acres from last year (+4%)
All Wheat: estimated at 47.4 million acres for 2022, up 0.6 million acres from last year (+1%)
North Dakota was the biggest wild card with 2022 acres compared to last year at -12% corn, -3.4% soybeans, +11.1% hard red wheat, +11.4% durum wheat, and spring wheat -5.5%. Given that its North Dakota, this affects actual total corn and soybean production far less than the loss in total acres. Trade maybe took that into consideration. Old crop corn traded close to limit higher but never touched limit, new crop corn touched limit briefly on the initial reaction after the report. Today’s report was extremely bearish for soybeans which anchored back corn.
Grains stocks as of March 1, 2022.
Corn: stocks in all positions totaled 7.85 bln bushels, up 2% from March 1, 2021.
Soybeans: stocks in all positions totaled 1.93 bln bushels, up 24% from March 1, 2021.
All wheat: stocks in all positions totaled 1.02 bln bushels, down 22% from March 1, 2021.
HUGE bullish initial reaction in corn following the report but end the day 20 cents off the contract’s new high and well below the previous contract high of 747’0. It will be very interesting to see how we close the week, we have potential for a large weekly reversal in EITHER direction.

Funds could not dump soybean long positions fast enough following the prospective planting report. July soybeans found immediate support at the 50-day moving average.
